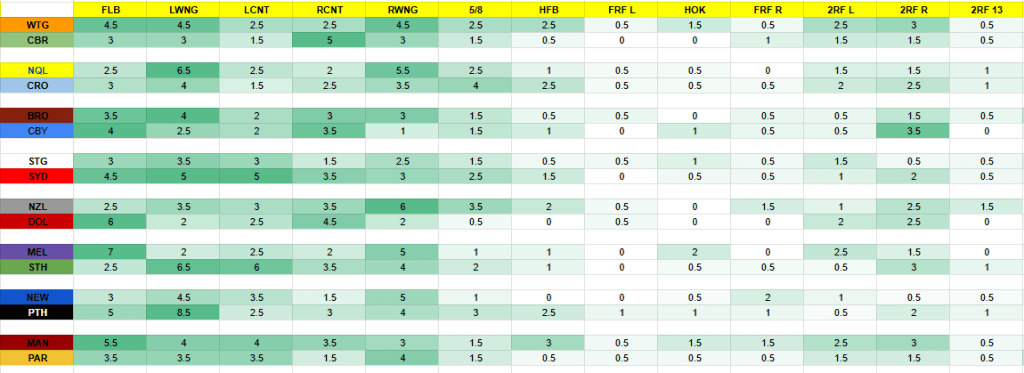
Alright champions, I’ve got something else for ya moving forward, and that is a handy heatmap of the most likely try scorers in every matchup each week. Basically it’s every position up against every position, measuring their tries scored vs tries conceded. It’s simple as fuck to read cunts, the darker the green in the cell, the more likely the player in that position will score. If you’re colourblind or some shit, don’t worry, I’ve got you covered too fuckeye, all you need to do is look for the higher numbers. Get around it punters, and don’t fuckin @ me if they don’t score, this isn’t my opinion dickheads, this is raw, factual data. Not my fault if you back a fuckin loser.
Anyway, here it is, may it lead to your eventual banning from your chosen punting outlet.